
World Bank data on the Logistics Performance Index
/Downloaded 11MAY2011 from http://tinyurl.com/yt88cf
The LPI is an interactive benchmarking tool created to help countries identify the challenges and opportunities they face in their performance on trade logistics and what they can do to improve their performance – the LPI 2010 allow for comparisons across 155 countries.
The Logistics Performance Index is based on a worldwide survey of operators on the ground (global freight forwarders and express carriers), providing feedback on the logistics “friendliness” of the countries in which they operate and those with which they trade. They combine in-depth knowledge of the countries in which they operate with informed qualitative assessments of other countries with which they trade, and experience of global logistics environment.
Feedback from operators is supplemented with quantitative data on the performance of key components of the logistics chain in the country of work, data collected for nearly 130 countries. A copy of the questionnaire (pdf - 1.3mb) can be downloaded here.
The LPI consists therefore of both qualitative and quantitative measures and helps build profiles of logistics friendliness for these countries. It measures performance along the logistics supply chain within a country and offers two different perspectives: International and Domestic.
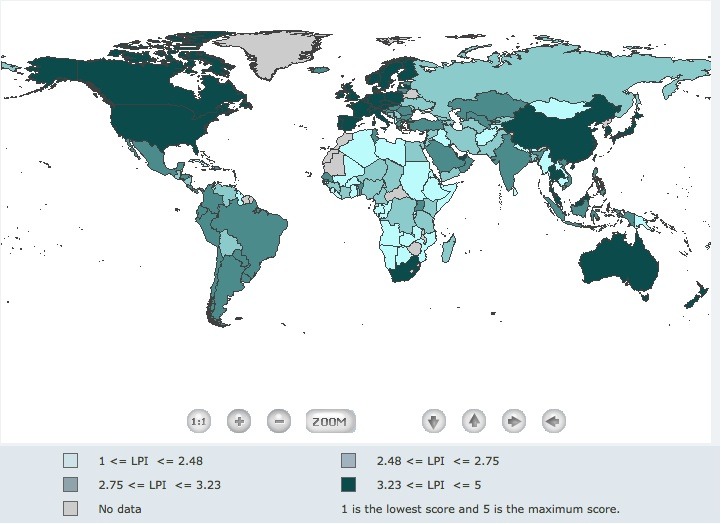
International LPI: ranking (Figure)
The countries are color-coded based on their performance on the LPI index and on each of the selected key dimension. Place the cursor over any country and the relevant score will pop up.
International LPI ranking (Table)
By default, the table is sorted by the Logistics Performance Index (LPI). Click on the  icons to sort by other categories in ascending order. Please click on the country name for the detailed information on the Country Scorecard.
The scores are from one to five, one being the worst performance for the given dimension.
The LPI also allows deriving a country’s Logistics Performance Index (LPI). Results are averaged for each key dimension by country rated.
To facilitate meaningful comparisons, results have been averaged by regions, which are defined by the World Bank classification with an equal weight for each country in the survey. We also averaged results by income per capita groups: high income, middle income, and low income countries.
Regions and income per capita groups are defined by the World Bank country classification. You can download from here a quick summary of the LPI coverage of countries.